Exercice : Question 7

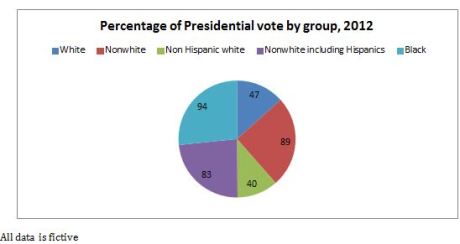
In this graph representing support for Obama in the 2012 presidential elections in the United States, which group was the second least likely to vote for this candidate?
Votre choixChoix attenduRéponse
You will also study the mechanics of American and British politics and government. One of the things you will be required to do is to read the media extensively, graphs, speeches and political theory.